When evaluating the performance of photovoltaic (PV) systems, the use of precise, high-accuracy irradiance sensors is crucial. The selection of these irradiance sensors affects Plane of Array (POA) measurements in the field. The irradiance data discussed in this article refers to POA data obtained using thermopile pyranometers or irradiance sensors. In this analysis, we will explain step-by-step, with example calculations, how the irradiance data obtained from these sensors should be used in calculations and how it should be interpreted.
What Is Plane of Array (POA) Irradiance?
POA is the total solar radiation incident perpendicular to the surface of solar panels. This radiation data reflects the actual Irradiance conditions on the panel plane. Therefore, POA is the most accurate measurement in PV performance analysis. POA data consists of the following components:
- Direct (Beam) Irradiance
- Diffuse Irradiance
- Reflected Irradiance
In POA measurement, the pyranometer must be positioned at the same tilt and azimuth as the panel. This positioning is extremely critical for measurement and calculation accuracy. Extreme care must be taken to distinguish positioning and measurement errors.
Sample Daily POA and PV Performance Calculation
The following example system specifications and the steps for analyzing the performance of a PV system using one day’s POA irradiation data are described below.
- Class A Thermopile Pyranometer for POA measurement
- Irradiance measurement interval: 5 minutes
- Panel angle: 25° (South-facing)
- Installed capacity 100 kWp (P0)
- Daily POA irradiance 6.80 kWh/m² (HPOA)
- Daily actual production 580 kWh (EAC)
- Gi,ref is 1000 W/m²
Note: The following formulas provide only a rough approximation. In actual calculations, a more detailed analysis should be performed, and system losses should be taken into account.
1. Performance Ratio (PR) Calculation
The Performance Ratio calculation is the ratio between the system’s actual production and its theoretical production.
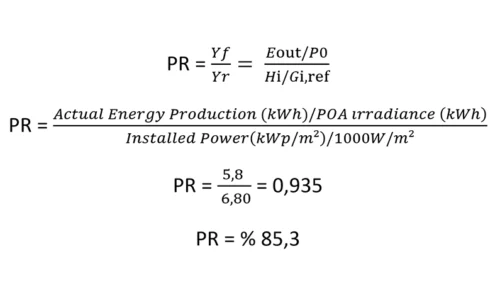
The PR value is one of the most frequently used indicators for evaluating how efficiently a system operates. The closer the PR ratio is to 1, the more efficient the system is.
In the sample calculation, the daily performance rate for the sample site is 85.3%. This result indicates that the system performed exceptionally well on that day. However, to make a definitive assessment, it is necessary to examine data over longer periods (monthly or annual).
The PR value is not always the same; it can vary depending on factors such as the climate of the location where the system is installed, the accuracy of the measurements taken, and the time frame over which the calculation is made. In daily calculations, it is normal for the PR value to exceed 90%. According to these calculations, this indicates that the facility has a very good performance ratio. However, in the longer term—that is, in monthly or annual evaluations—this value may be slightly lower. A PR value of 80% or higher is considered an acceptable performance ratio. Therefore, to evaluate the system most accurately, it is advisable to review the PR on a monthly or annual basis whenever possible.
2. Specific Yield
Specific Production (SPP) is an indicator of how much energy a solar power plant produces relative to its installed capacity. This measurement is frequently used to understand the efficiency of the system. SPP calculations are evaluated together with POA (Point of Activity) irradiation and are used in climatic and regional irradiation analyses.
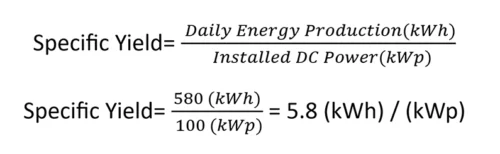
This result indicates that the system produces an average of 5.8 kWh of energy per day for every 1 kWp of installed capacity.
In Turkey, during the summer months, a daily specific production of 5.5–6.5 kWh/kWp on a plant with a constant slope and uninterrupted production indicates good performance in most cases. However, this value may vary to some extent depending on the region where the plant is located, the weather conditions during that period, and the installation and operating characteristics of the system.
3. Comparison with Expected Production
To evaluate daily production performance, the actual production value is compared with simulation results.
For example, a simulation program like PVsyst predicted 600 kWh of production under 6.20 kWh/m² POA irradiation for the same day. In reality, the system produced 580 kWh that day. In this case, the system’s performance for that day is evaluated by comparing the expected production with the actual production.
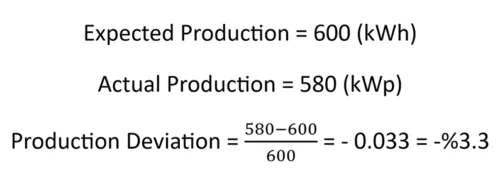
In other words, the production variance is found to be -3.3%. This means that actual production fell short of expected production by 3.3%.
Based on this result, we can see that the current system fell slightly short of the expected production for that day. Expected production can be forecasted using simulation programs. However, while simulation programs provide a general idea, they should not be considered definitive results on their own. The most accurate assessment is made when viewed alongside actual production data.
To interpret the difference between expected and actual production, a specific tolerance range is typically defined for each site. This range should be determined by considering the accuracy level of the model used and measurement uncertainties. For example, in many applications, a threshold of approximately ±10% is accepted. However, these ranges may vary depending on operational conditions and system characteristics.
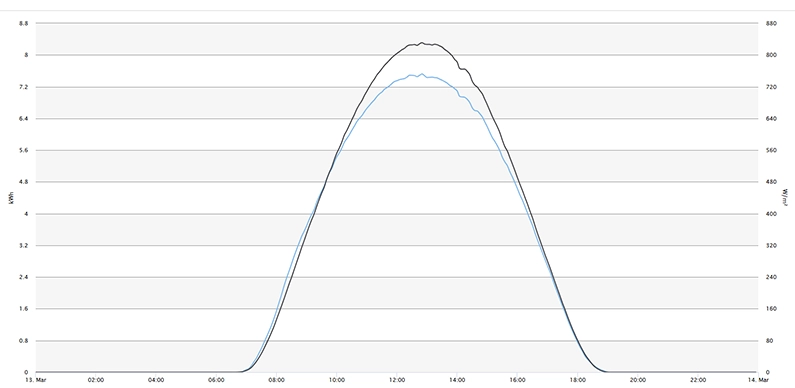
4. The Relationship Between Irradiance and Production with Graph
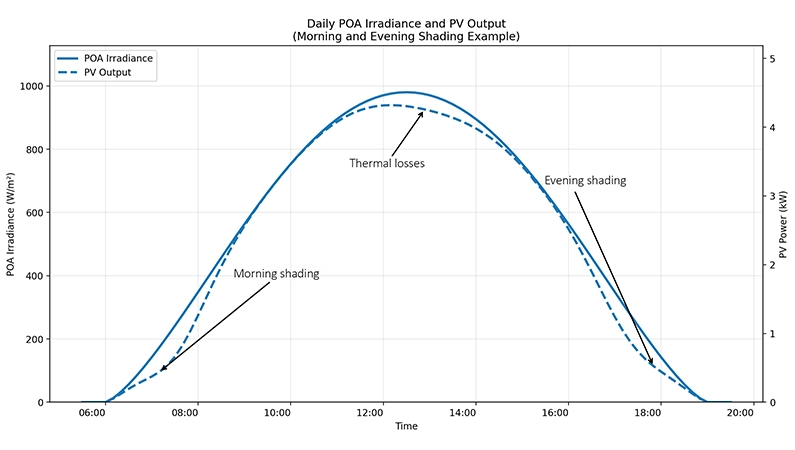
Analyzing POA data and PV production together on a graph is useful for understanding the system’s behavior. It is also very helpful in identifying potential problems. When the relationship between radiation and production is plotted as a time series, the following can be easily analyzed:
- Shading during morning and evening hours
- Thermal losses and the effects of excessive heat during midday hours
- Losses due to the need for cleaning
- System losses (inverter, cabling, etc.)
These graphs can be easily prepared using Excel, Python, or PV monitoring software. When monitored regularly, they become a very useful tool for detecting performance changes in the system at an early stage.
In conclusion, this article examines how PV performance is analyzed through calculations using one day’s POA data. These calculations and analyses allow for the early detection of system efficiency, cleaning needs, thermal losses, and potential performance drops. Accurate POA measurements using a thermopile pyranometer increase the reliability of these analyses, providing high accuracy in maintenance planning and energy forecasting.
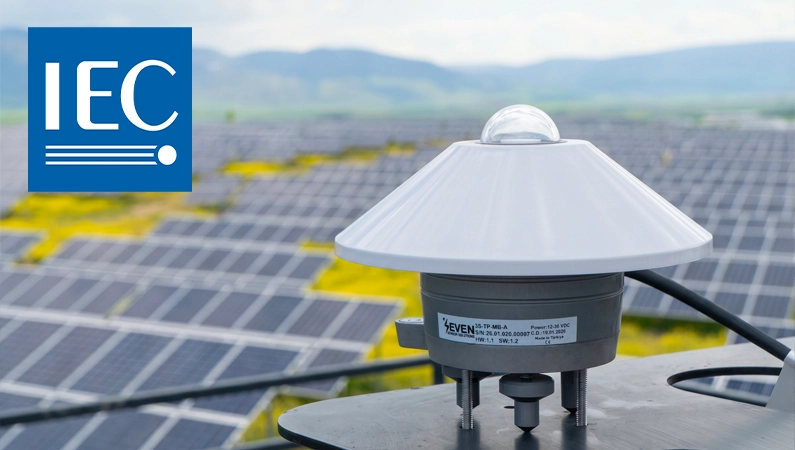
The SEVEN 3S-TP-MB-A Thermopile Pyranometer allows you to monitor POA radiation data more securely. For more detailed information, please contact SEVEN Sensor Solution.
Frequently Asked Questions
What is a Thermopile Pyranometer?
Thermopile pyranometers are sensors that measure broad-spectrum solar radiation in the 280-3000 nm range with high accuracy.
What determines the accuracy of POA irradiance measurements?
The accuracy of POA measurement depends on the tilt and azimuth of the pyranometer or radiation sensor being positioned at the same angle as the PV panel.
Why should analysis be performed using POA data?
GHI (Global Horizontal Irradiance) is commonly used data, but it does not reflect the irradiance falling on the panel plane. POA (Plane of Array), on the other hand, is the most accurate plane ııradiance data. It represents the actual panel ırradiance.
What is the Performance Ratio (PR)?
PR is the ratio of the actual production of a solar power plant to its ideal production. It is used to measure efficiency.
Why doesn’t the PR reach 100%?
Output losses occur due to factors such as module heating, inverter losses, cable resistance, dirt, and shading. For this reason, the PR does not theoretically reach 100%.